Sabtu, 30 April 2011

Chris Grayling use of crime statistics 'mislead' public

Shadow home secretary Chris Grayling has been accused of misleading the public in his use of crime statistics.
The Tories have said data shows a big rise in violent crime during Labour's time in government - but the way the figures were compiled changed in 2002.
Now the chairman of the UK Statistics Authority has told Mr Grayling his statements are "likely to damage public trust in official statistics".
But Mr Grayling said the Tories would continue to argue that crime had risen.
Home Secretary Alan Johnson has said his opposite number should apologise.
'Likely to mislead'
Mr Grayling had to defend his position on Wednesday after the Conservatives sent the figures to activists in constituencies throughout England and Wales in an effort to demonstrate the government's failure on law and order.
I must take issue with what you said yesterday about violent crime statistics, which seems to me likely to damage public trust in official statistics
Sir Michael Scholar's letter to the Conservatives
The BBC's home editor Mark Easton said the method of recording violent crime had changed in 2002, making the figures for the periods before and after that date non-comparable.
Now Sir Michael Scholar, chairman of the UK Statistics Authority, has written to Mr Grayling saying: "I do not wish to become involved in political controversy, but I must take issue with what you said yesterday about violent crime statistics, which seems to me likely to damage public trust in official statistics."
In notes attached to the letter, the statistics authority said it regarded "a comparison, without qualification, of police-recorded statistics between the late 1990s and 2008/09 as likely to mislead the public".
The authority said the British Crime Survey (BCS), an annual questionnaire of 46,000 people, indicated there had been a big fall in violent crime since 1995.
It said the BCS was the most reliable way of assessing the trend, because it was "not affected by changes in reporting, police recording and local policing activity, and has been measuring crime in a consistent way since the survey began in 1981".
Responding to Sir Michael's letter, Mr Grayling told the BBC he was "quite happy to reflect changes in methodology when talking about these figures in the future".
MARK EASTON'S UK
Letter by Sir Michael Scholar

But he insisted: "The reality is these figures actually reflect real crimes, reported to real police stations, by real people.
"And the reality is however you caveat these figures, whatever qualifications you make about changes to the recording methods, they show a big increase in violent crime over the past decade and we are going to carry on saying that."
He added that he continued to believe the BCS, as a measure of crime, was "highly flawed".
'Selective'
The home secretary claimed the Conservatives had "plenty of form" when it came to the use of statistics for political ends.
"Now it has been confirmed officially that they have continually misled the public about crime," Mr Johnson said.
This is not the first time the statistics body has taken politicians to task for their use and interpretation of crime-related figures.
In 2008, it criticised Labour ministers for releasing what it said was "premature and selective" data about hospital admissions for knife wounds in certain parts of the country. The then Home Secretary Jacqui Smith apologised for the early release.

Source: http://news.bbc.co.uk
Selasa, 26 April 2011

Statistics Can Be Misleading

A very interested information about stats, here is:


Author:  Lori Alden
Audience:  High school and college economics students
Summary:   With this series of 12 puzzles, you can help your students become more discriminating consumers of economic statistics.   
Procedure:  Each of the following problems shows one or more misleading statistics.  See if your students can figure out why they're misleading.
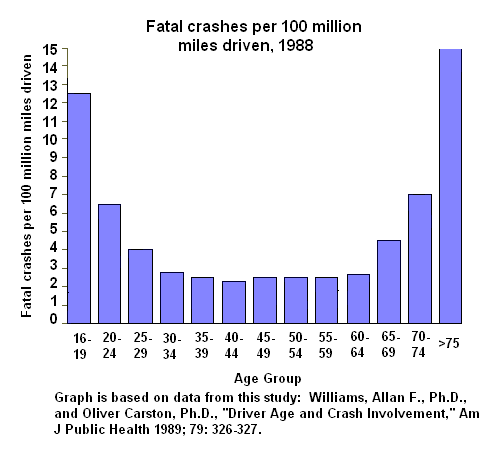
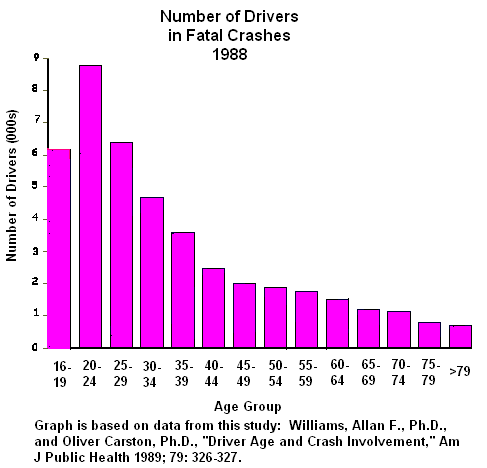
1.  The following statistics suggest that 16-year-olds are safer drivers than people in their twenties, and that octogenarians are very safe.  Is this true?
Solution:  No.  As the following graph shows, the reason 16-year-old and octogenarians appear to be safe drivers is that they don't drive nearly as much as people in other age groups. 

2.  On November 13, 2000, Newsweek published the following poll results:
Since 9% said that Nader was the only candidate worth voting for, one would have expected him to get at least 9% of the vote in the 2000 election.  He only got about 3%.  What happened?
Solution:
There was a biased statistic because the sample wasn't randomly drawn from the population.  A disproportionate number of Nader supporters participated in the poll in order to make him appear more viable as a candidate.
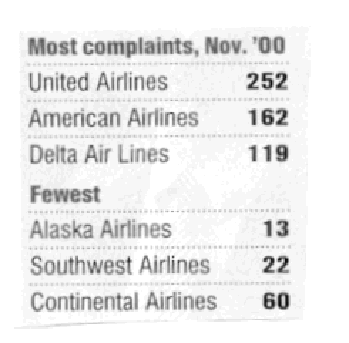
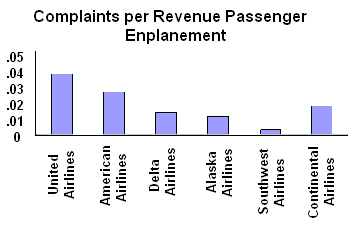
3.  Consider these complaints about airlines published in US News and World Report on February 5, 2001:
Can we conclude that United, American, and Delta are the worst airlines and Alaska, Southwest, and Continental are the best? Solution:  No.  The airlines that had the most complaints also had the most passengers.  As the following graph shows, rates and percentages are often more informative than raw numbers.
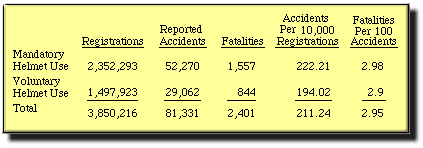
4.  The following statistics about motorcycle helmet use seem to suggest that helmets cause more injuries and fatalities.  Is it really safer to go without helmets?
Source:   Motorcycle Statistical Annual, Motorcycle Industry Council, Inc., 1994, as reported on http://www.bikersrights.com/statistics/stats.html.
Solution:  Correlation doesn't prove causation.  The statistics suggest that helmets cause accidents and fatalities, but it's possible that a high number of motorcycle accidents and fatalities in high-risk states caused them to adopt mandatory helmet laws.  
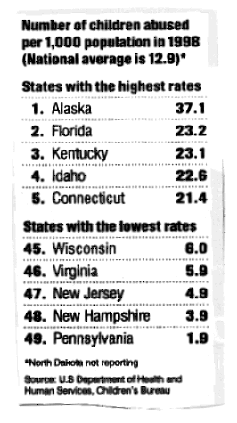
5.  This clipping from US News and World Report on 1/29/01 suggests that Alaskans are terrible parents.  Is this true?
Solution:  The difference in the abuse rates probably stems from different definitions for abuse in the various states.  For example, Alaska (the "worst" state) says that a child is abused if his or her health or welfare is harmed or threatened.  Pennsylvania (the "best" state) defines it as a recent act or failure to act.
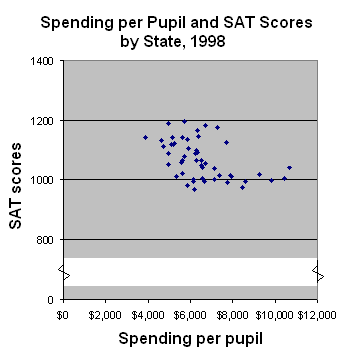
6.  Columnist George Will wrote in the Washington Post in 1993 that  "... the 10 states with the lowest per pupil spending included four — North Dakota, South Dakota, Tennessee, Utah — among the 10 states with the top SAT scores ... New Jersey has the highest per pupil expenditures, an astonishing $10,561… [Its] rank regarding SAT scores? Thirty-ninth." 
This negative correlation between spending per pupil and SAT performance seems to be borne out by this graph:
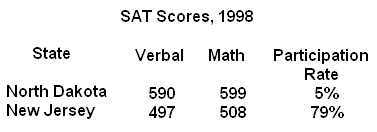
And by this one:
Does this mean that spending more on education makes students worse off?
Solution:  The results are more likely due to differing SAT participation rates in the states (Colleges in North Dakota and other states require the ACT rather than the SAT for college admissions).  The students who take the SAT in North Dakota include many who plan to apply to elite out-of-state colleges.
This caused a sampling bias, since the sample wasn't representative of the population.
7.   Researchers (Arthur Kellermann et. al., "Gun Ownership as a Risk Factor for Homicide in the Home," The New England Journal of Medicine, October 7, 1993, pp. 1084-1091), found that gun owners are 2.7 times more likely to be murdered than non-owners.  Does this mean it's safer to not have guns in the house?
Solution:  Perhaps, but correlation does not imply causation.  It may be true that guns cause murders, but it might also be true that having a greater risk of being murdered causes people to own guns.
8.  "The best public schools offer a more challenging curriculum than most private schools."  Are public schools therefore better than private schools?
Solution:  We're being asked to compare apples with oranges:  the best public schools versus most private schools.
9.  "Fluoride consumption by human beings increases the general cancer death rate.   ….  [P]eople in fluoridated areas have a higher cancer death rate than those in non-fluoridated areas."  Should fluoridation be prohibited?
Solution:  Affluent areas are more likely to have fluoridation and they're also more likely to have older populations who are more likely to get cancer.
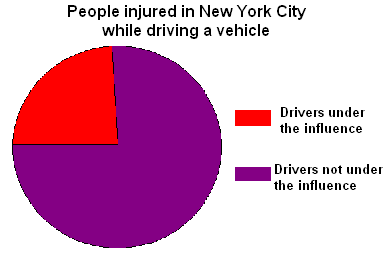
10.  Can we conclude from the following diagram that it's safer to drive while under the influence?
 
Solution:  No.  Drunk drivers have a fatality risk 7.66 times the norm, while non-drunk drivers have a risk only about .6 of the norm.  Only a very small percentage of drivers in New York City drive while under the influence, but they account for a disproportionate number of accidents.
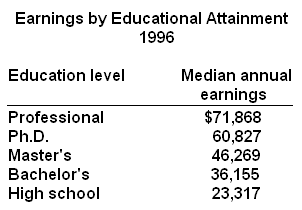
11.  The Monthly Labor Review published the following data, showing how earnings vary with education:
Can we conclude that getting a bachelor's degree will increase your earnings by almost $13,000 a year?
Solution:  Not necessarily.  Intelligence and drive also explain the differences in earnings, people with intelligence and drive are more likely to go to college.
12.  Allen Hershkowitz, senior scientist with the Natural Resources Defense Council, wrote that "a  well-run curbside recycling program can cost anywhere from $50 to more than $150 per ton of materials collected. Typical trash collection and disposal programs, on the other hand, cost anywhere from $70 to more than $200 per ton."  Does recycling save money?
Solution:  Hershkowitz asks us to compare apples with oranges:  a well-run curbside recycling program with typical trash collection and disposal programs.


© Lori Alden, 2005-7.  All rights reserved.  You may download the content, provided you only use the content for your own personal, non-commercial use.  Lori Alden reserves complete title and full intellectual property rights in any content you download from this web site. Except as noted above, any other use, including the reproduction, modification, distribution, transmission, republication, display, or performance, of the content on this site is strictly prohibited.

source: http://www.econoclass.com

About Crime Statistics


When crimes such as burglaries, robberies or homicides are reported, this information goes into statistical databases that are utilized for a number of purposes. Crime statistics are often used to measure the safety of a specific area such as a neighborhood, city, state or nation. Crime statistics also help law enforcement officials set planning and budgeting priorities. In addition, lawmakers rely on these figures in setting sentencing guidelines and devising programs to aid crime victims.
  1. Function

    • In order to better understand and control crime, accurate counts of its occurrence are needed. Crime statistics represent the recorded incidence of criminal behavior. These figures are typically compiled as uniform data on offenses and offenders derived from records of criminal justice agencies. Official crime statistics are published annually or periodically in relatively standard formats. The federal government's Bureau of Justice Statistics is the primary source of crime statistics in the United States.

    History

    • Crime statistic collection emerged in the early 19th century to measure whether criminal activity in certain areas was increasing or decreasing. France began systematically collecting national judicial statistics on prosecutions and convictions in 1825. Beginning in 1857, Great Britain was the first nation to systematically collect police data. In 1920, American criminologist August Vollmer proposed a national bureau of criminal records. The International Association of Chiefs of Police acted on this suggestion in 1927 by developing a plan for a national system of police statistics that would include known offenses and arrests collected from local police departments in each state. The Federal Bureau of Investigation became the clearinghouse for these statistics and published the first of its now-annual Uniform Crime Reports in 1931.
      To meet a growing need for more flexible, in-depth data, the FBI has supplemented its Uniform Crime Reports in recent years with what's known as the National Incident-Based Reporting System. Another relatively new wrinkle is the National Crime Victimization Survey, which collects data on the frequency, characteristics and consequences of criminal victimization from a nationally representative sample of 76,000 households.

    Types

    • The most frequently referenced classifications of criminal statistics are violent crimes and property crimes. Violent crimes include homicide, rape, robbery and assault. Property crimes consist of burglaries, thefts and motor vehicle thefts.

    Time Frame

    • During 2007, an estimated 1.4 million violent crimes occurred in the United States, according to the FBI's Uniform Crime Reporting Program. This total represented a .7 percent decrease from the prior year. Aggravated assault was the most commonly reported violent crime, accounting for nearly 61 percent of the overall tally.
      Also in 2007, there were an estimated 9.8 million property crime offenses in the United States., which was 1.4 percent less than 2006. The 2007 property crime total resulted in an estimated $17.6 billion in losses.

    Prevention/Solution

    • One goal of gathering and publishing crime statistics is to determine where offenses are taking place so officials can take action to combat the problem. Crime statistics may prompt police to increase patrols in specific crime-prone areas. The same statistics also might lead government agencies to offer tax incentives to businesses in hopes of creating more commerce and providing additional jobs in these areas as a deterrent to crime.
Source: www.ehow.com

Rabu, 06 April 2011

Is GDP An Obsolete Measure of Progress?

Seperti judulnya, pertanyaan inilah yang akan dijawab dalam artikel ini. Ada ukuran lain, selain GDP (PDB) atau usia harapan hidup, yang lebih dapat mendeskripsikan ukuran kemakmuran suatu negara, yaitu Happy Planet Index (HPI) atau mungkin kita lebih familiar dengan istilah Indeks Kebahagiaan. HPI mengkombinasikan metrik ekonomi dengan ukuran-ukuran lain yang bersifat subjektif, seperti kepuasan hidup. Pada tahun 2007 perusahaan riset Frontier telah melakukan metode riset ini. Metode ini sangat masuk akal dan tentu saja tidak dapat dipungkiri, karena apa artinya jika secara angka pertumbuhan ekonomi meningkat, tetapi setiap warga negara tidak merasa aman di negaranya sendiri. Apa artinya jika rata-rata usia harapan hidup di suatu negara meningkat, tetapi selama masa hidupnya itu mereka tidak menikmati kehidupannya. Karena itu, sudah semestinya data-data pemerintah didukung oleh data kualitatif untuk melengkapi data kuantitatif, yang tentunya menunjang dalam pengambilan keputusan. Perhitungannya? Sangat yakin kalau analisa statistik yang digunakan, tentunya akan berbicara lebih.


Chris Hondros / Getty
Since last summer the nation's Gross Domestic Product (GDP) has gone up — indeed, it grew at a surprising 5.7% rate in the 4th quarter — seeming to confirm what we've been hearing: the recession is officially over. But wait — foreclosure and unemployment rates remain high, and food banks are seeing record demand. Could it be that the GDP, that gold standard of economic data, might not be the best way to gauge a nation's relative prosperity?

Since it became the prime economic indicator during the Second World War (to monitor war production) many have criticized policy-makers' reliance on the GDP — and proposed substitute measures. For example, there is the Human Development Index (HDI), used by the UN's Development Programme, which considers life expectancy and literacy as well as standard of living as determined by GDP. And the Genuine Progress Indicator, which incorporates aspects of social welfare such as income equity, pollution, and access to health care. In the international community, perhaps the biggest nudge has come from French President Nicolas Sarkozy, who commissioned a report by marquee-name economists, including Nobel laureates Joseph Stiglitz and Amartya Sen, to find alternatives to what he calls "GDP fetishism".